Free printable maker
Multiplication Chart and Times Table Test Generator
A large-print multiplication chart to 10, 12 or 15, full, blank or partly blank, with square numbers or colour bands. Or a times table test on the tables you choose, 20 to 100 questions, with an answer key. Free, no account.
Prints one page. Free, no account.
Multiplication chart 1–12
Reference chart| × | 1 | 2 | 3 | 4 | 5 | 6 | 7 | 8 | 9 | 10 | 11 | 12 |
| 1 | 1 | 2 | 3 | 4 | 5 | 6 | 7 | 8 | 9 | 10 | 11 | 12 |
| 2 | 2 | 4 | 6 | 8 | 10 | 12 | 14 | 16 | 18 | 20 | 22 | 24 |
| 3 | 3 | 6 | 9 | 12 | 15 | 18 | 21 | 24 | 27 | 30 | 33 | 36 |
| 4 | 4 | 8 | 12 | 16 | 20 | 24 | 28 | 32 | 36 | 40 | 44 | 48 |
| 5 | 5 | 10 | 15 | 20 | 25 | 30 | 35 | 40 | 45 | 50 | 55 | 60 |
| 6 | 6 | 12 | 18 | 24 | 30 | 36 | 42 | 48 | 54 | 60 | 66 | 72 |
| 7 | 7 | 14 | 21 | 28 | 35 | 42 | 49 | 56 | 63 | 70 | 77 | 84 |
| 8 | 8 | 16 | 24 | 32 | 40 | 48 | 56 | 64 | 72 | 80 | 88 | 96 |
| 9 | 9 | 18 | 27 | 36 | 45 | 54 | 63 | 72 | 81 | 90 | 99 | 108 |
| 10 | 10 | 20 | 30 | 40 | 50 | 60 | 70 | 80 | 90 | 100 | 110 | 120 |
| 11 | 11 | 22 | 33 | 44 | 55 | 66 | 77 | 88 | 99 | 110 | 121 | 132 |
| 12 | 12 | 24 | 36 | 48 | 60 | 72 | 84 | 96 | 108 | 120 | 132 | 144 |
getworksheet.co/tools/multiplication-chart-generator
Using the chart and the test
From a reference chart to recall
A multiplication chart is a reference first and a learning tool second. Taped inside a folder or stuck to the desk, the full chart lets a child keep going with long multiplication or fractions while the facts are still being learned, instead of stalling on 7 × 8. Print it 1 to 10 for younger classes and 1 to 12 once the elevens and twelves are taught; the 1 to 15 version suits children who like to see the pattern continue.
Colour helps the pattern show. Highlighting the square numbers down the diagonal makes the chart’s symmetry obvious: everything above the line mirrors everything below it, so 3 × 7 and 7 × 3 are the same fact and there are only about half as many to learn as the grid suggests. Giving each table a colour band makes the sheet easier to scan when a child is looking up a single table.
The partly blank chart is the step between reference and recall. At 30% missing the child fills gaps using the neighbours (one more than 6 × 7 is 6 × 8); at 70% they are mostly recalling, with just enough anchors to self-check. The fully blank chart, timed, is the classic end-of-unit challenge, and “two charts per page” gives two half-size copies for a before-and-after.
Times table tests should be short and specific. Tick only the tables being learned this week, 20 or 36 questions, and keep the score line so the child can see the number rise. “In order” prints each table from 1 × to 12 ×, which is right for a brand-new table; switch to “mixed up” as soon as the child can recite it, because a mixed test is the only one that shows real recall. The 100-question sheet is the five-minute speed test many schools use.
The missing factor variant (7 × __ = 56) and the division facts variant (56 ÷ 7 = __) are the same fact family seen from the other side. Introducing them once the products are fluent turns a times table into a division table at almost no cost and is the groundwork for factors, simplifying fractions and algebra.
For worked practice, the multiplication worksheets and the single-table sets such as the 2 times table and 5 times table are ready to print; the math fact generator drills multiplication alongside the other three operations.
How it works
How to make a multiplication chart or times table test
Three steps from a chart size or a set of tables to a printed sheet with its key.
- 1
Pick chart or test
A multiplication chart (1–10, 1–12, up to 15; full, blank or partly blank; colour-coded) or a times table test on the tables you tick.
- 2
Set the sheet
For the chart: missing percentage, colours, two per page. For the test: 20 to 100 questions, mixed or in order, products, missing factor or division facts, layout, time and score line.
- 3
Print
Letter or A4. The test prints first and the answer key follows on its own page. Shuffle for a new set with the same settings.
Good to know
Questions, answered
Yes. Print a chart or a times table test with its answer key: no account, no watermark, no limit. Everything is drawn in your browser, so the chart scales to fill a Letter or A4 page in large print.
1 to 10, 1 to 12, 1 to 15, or any largest number from 5 to 15. Fill it in full as a reference chart, print it blank for the student to complete, or partly blank with a slider from 10% to 90% of the products missing. Colour options highlight the square numbers down the diagonal or give each table its own soft band. Tick "Two charts per page" for two half-page copies.
Tick the tables to include (1 to 12, with shortcuts for all, the 2-5-10 set and the hard 3-9 set), choose 20, 36, 60 or 100 questions, mixed up or in order, and the question type: products (7 × 8 = __), missing factor (7 × __ = 56) or division facts (56 ÷ 7 = __). Horizontal and vertical drill layouts are both available, with a time and score line.
Yes. The test prints with its answer key on the next page, laid out identically with the answers filled in. For a blank or partly blank chart, the full chart prints as the key.
Yes. The questions and the missing cells come from a seed, so the same settings give the same sheet until you press Shuffle. That lets you give a whole class one test, or print a fresh one every week with identical settings. US Letter and A4; save as PDF from the print dialog.
More free printable makers
More sheets you can make right now
Each of these builds the printable in your browser: no account, no AI, no weekly limit, an answer key where one applies.
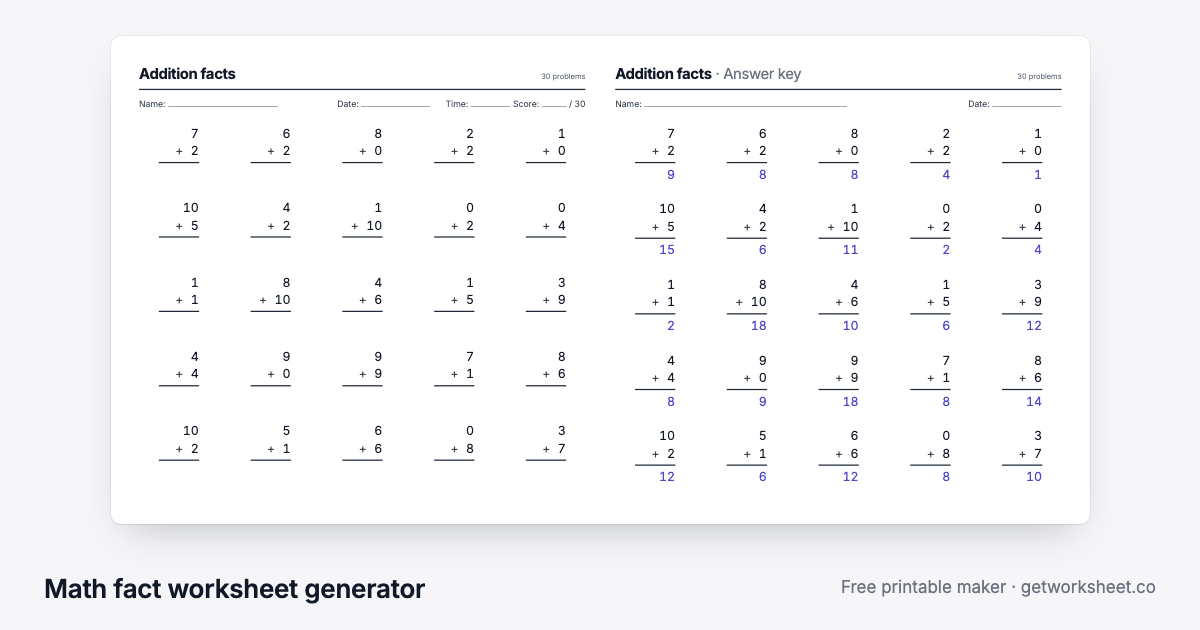 Math fact worksheet generatorAddition to division drills with an answer key. Free to print.
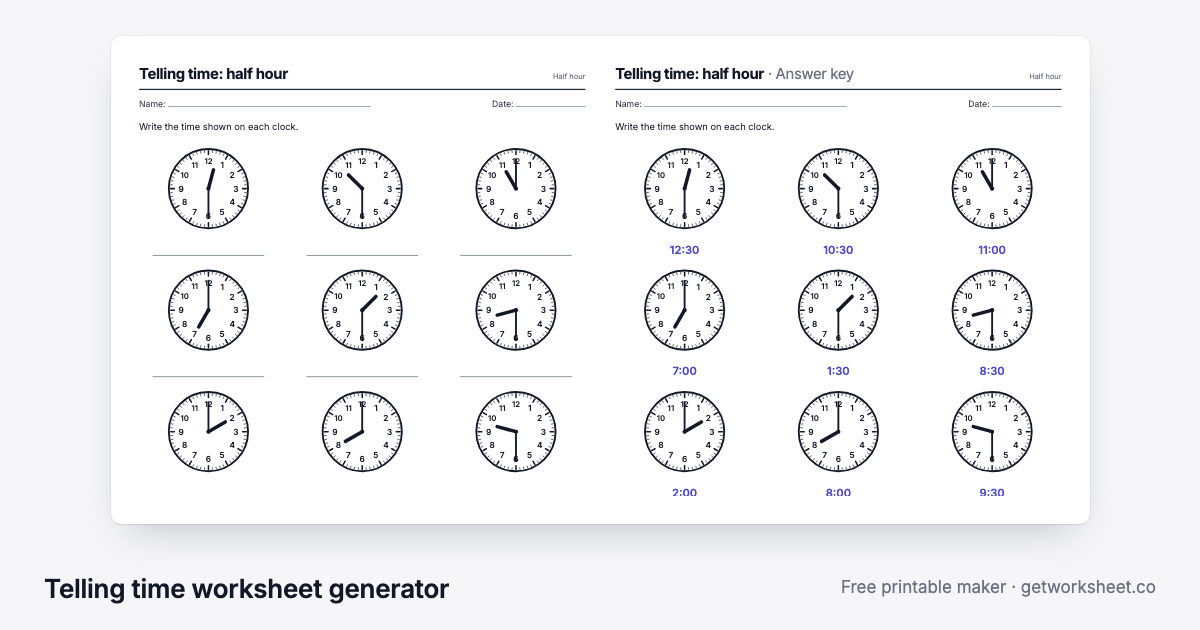 Telling time worksheet generatorAnalogue clocks to read, draw, match or add time to, with answer key. Free to print.
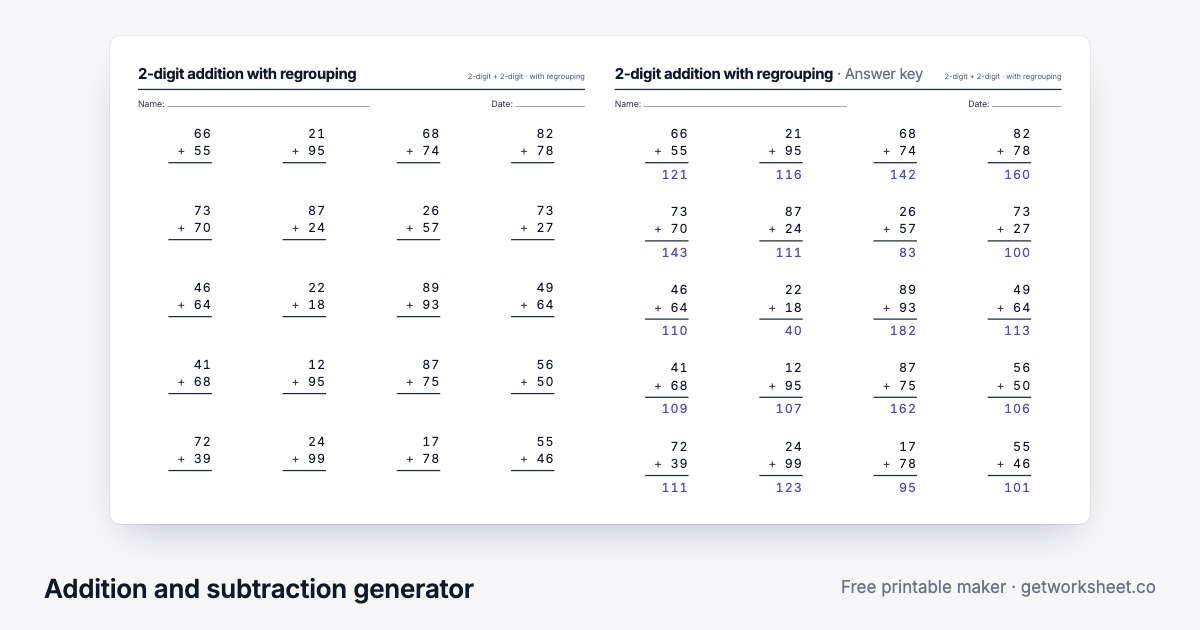 Addition and subtraction generatorColumn add and subtract, regrouping you control, boxes and key. Free to print.
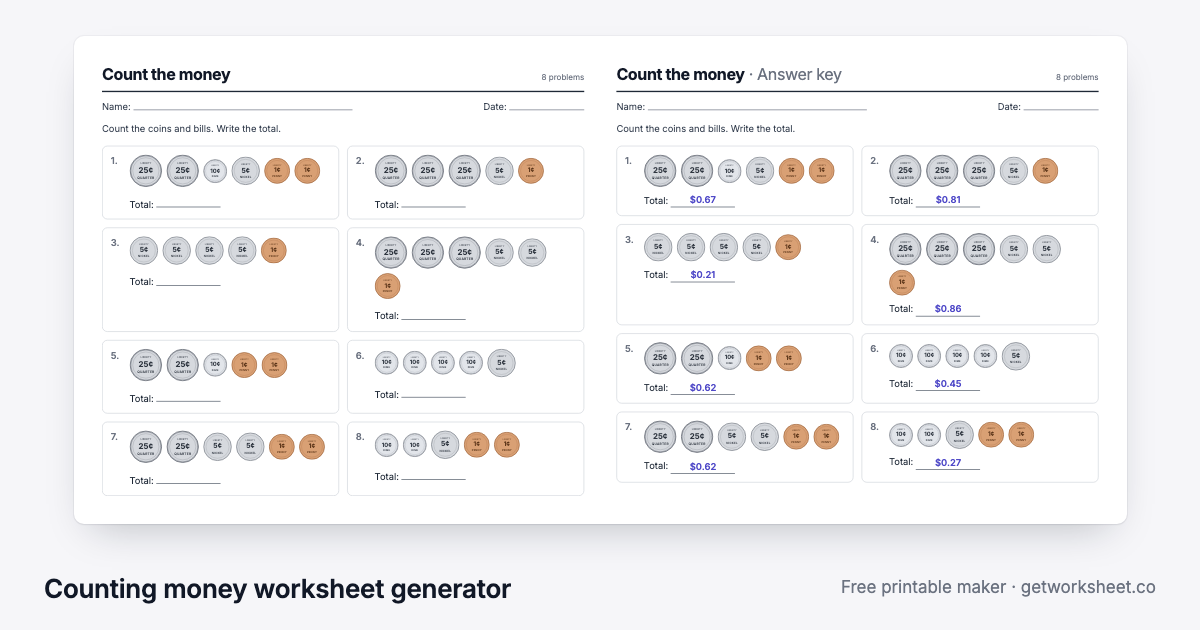 Counting money worksheet generatorCount US coins, make change, compare groups, write amounts. Answer key. Free to print.
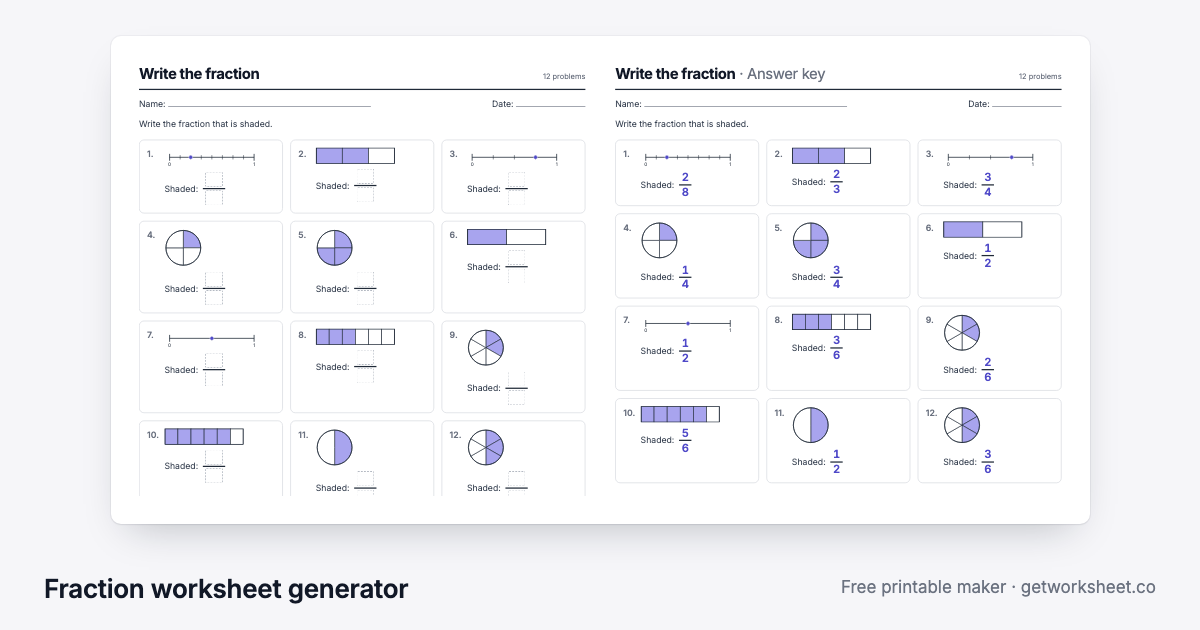 Fraction worksheet generatorVisual pie, bar and number-line models; equivalent, compare, add, subtract. Free to print.
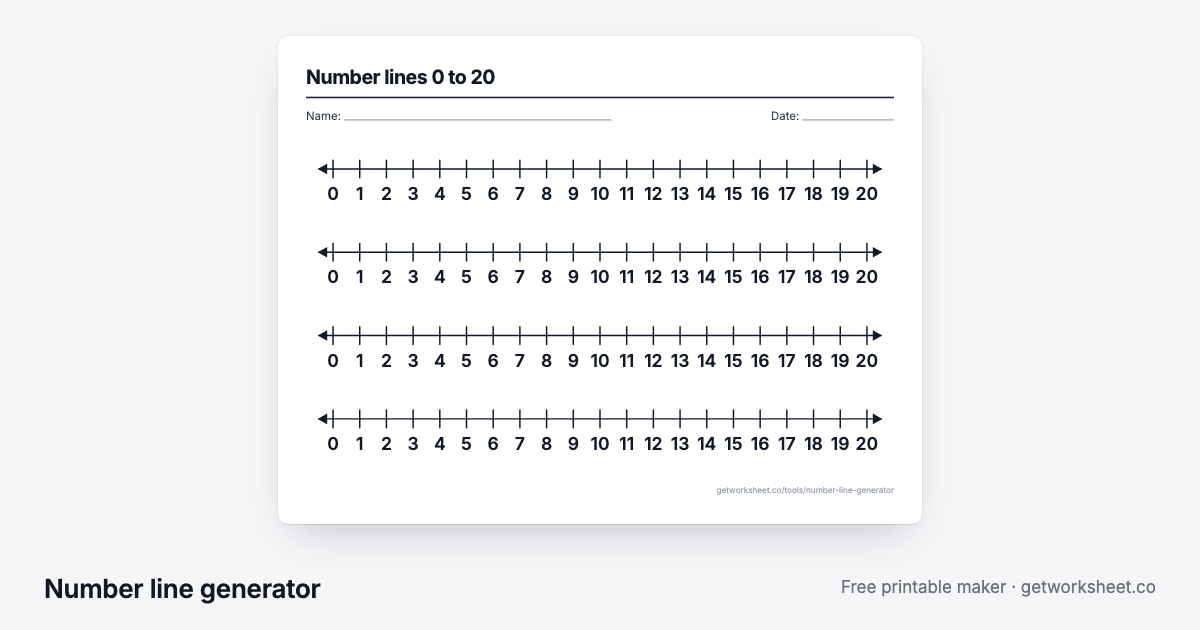 Number line generatorAny range and step, fractions and decimals, blank or missing numbers with a key. Free to print.
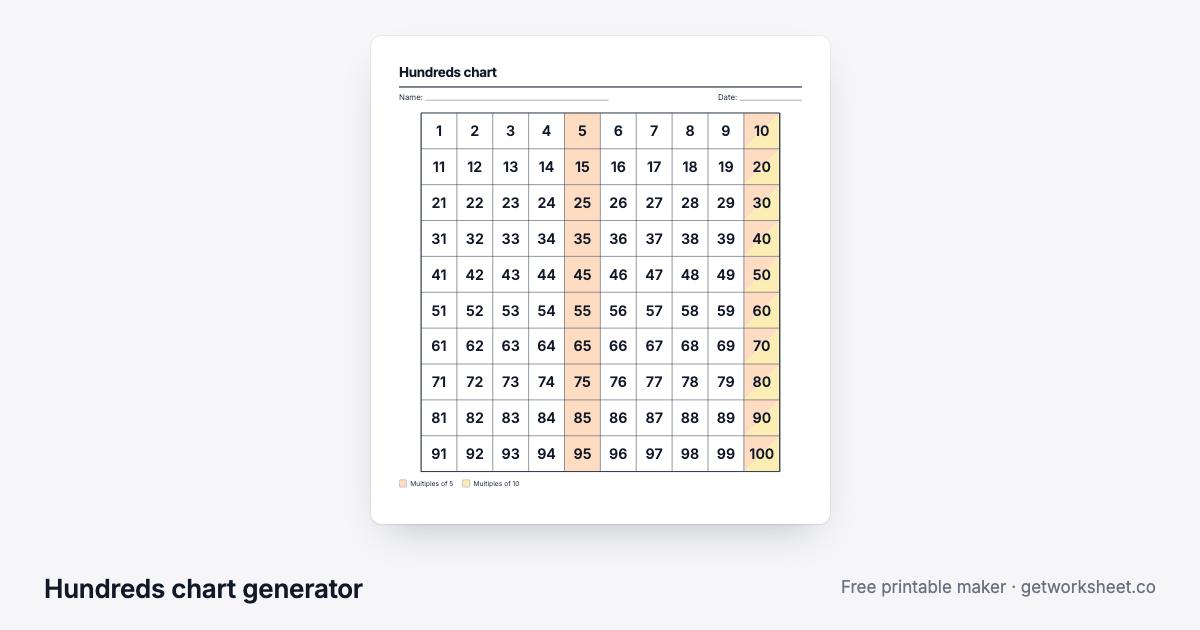 Hundreds chart generator1-100, 1-120 or 0-99, blank or missing numbers, skip-count colours, odd/even. Free to print.
- Worksheet generatorCustom worksheets for any topic, grade and question type.
- Lesson plan generatorStandards-aligned plans with objectives, activities and assessment.