Free printable maker
Hundreds Chart Generator
A 1–100, 1–120 or 0–99 chart, a blank grid, or a missing-numbers worksheet with its answer key. Colour the multiples of 2, 3, 4, 5 and 10 for skip counting, shade odd or even numbers, add a number-of-the-day box, print one large chart or two per page. Free, no account.
Hundreds chart
getworksheet.co/tools/hundreds-chart-generator
Using the chart
What a hundreds chart teaches, and which one to print
The hundreds chart is the place-value picture of our number system: moving one square right adds one, moving one square down adds ten. Children who have used one can add 10 or 20 to any number without counting, see that 47 is a row below 37, and find all the numbers ending in 5 in a single column. Print the 1–100 chart in large print for the youngest children and the wall; use the 1–120 chart in first grade where counting past 100 is the goal, and the 0–99 chart when you want each row to be one decade, which makes “the forties” a visible thing.
Missing numbers is the daily worksheet. Begin with 10 hidden on a 1–100 chart, where the child can read the neighbour above or beside; go to 30 or 50 when the gaps force them to count on from a known number; 70 hidden is a near-blank chart with scaffolding. The answer key on page two means a child can self-check, and two charts per page with different blanks stops copying.
Skip-counting colours turn the chart into a multiplication picture. Highlight the 2s and the 5s and the 10s appear in two colours where the patterns meet; highlight the 3s and children see the diagonal stripes that explain why 3s are harder to learn than 5s. Pair the printed chart with the skip counting worksheets and the colour-in pages in the hundreds chart worksheets collection.
Odd and even shading is the first pattern most children notice on their own: the shaded columns alternate, every even number ends in 0, 2, 4, 6 or 8, and adding two keeps you in the same colour. Use the shading with no number highlights for a kindergarten chart, then add the 2s highlight so the two ideas connect.
The blank grid is the end point: once a child can fill all one hundred squares from memory, the structure has gone in. It also doubles as a hundred board for Montessori-style work with number tiles, like the Montessori hundred board worksheets. Laminate one blank chart per child for dry-erase use and print the number-of-the-day box for a calendar-time routine: write the day's number, find it on the chart, say the number ten more and ten less.
Charts and number lines teach different things: the chart shows place value in rows, the line shows distance and order. Print the matching line from the number line generator, fill the gaps with the missing number worksheets, and when the facts are ready for a drill, the math fact worksheet generator takes it from there.
How it works
How to make a printable hundreds chart
Three steps from a blank page to the chart your class needs.
- 1
Pick the chart
All numbers, missing numbers or a blank grid; 1–100, 1–120 or 0–99.
- 2
Add highlights
Colour the multiples of 2, 3, 4, 5 or 10, shade odd or even numbers, add a "number of the day" box, choose one or two charts per page and large print.
- 3
Print
Letter or A4, one page, with the answer key as page two for missing-number charts. Save as PDF to keep it.
Good to know
Questions, answered
Yes. Choose the chart, the highlights and the layout and print or save as a PDF. No account, no watermark, no limit. The chart is drawn as a vector in your browser so the grid lines and numbers print sharp on any printer.
The 1–100 chart is the classic: ten rows, each ending in a multiple of ten. The 1–120 chart adds two rows and is the version used in US first grade (Common Core asks children to count to 120). The 0–99 chart starts at zero so every row holds one decade (0–9, 10–19, 20–29), which makes place value easier to see: all the forties are on one row.
Pick how many numbers to hide (10 to 70) and the generator blanks a different seeded set every time you press Shuffle. The answer key prints as page two with the hidden numbers in colour and outlined, so marking is a glance. With two charts per page each chart has its own set of blanks, so two children at the same table get different sheets.
Yes. Turn on any of 2s, 3s, 4s, 5s and 10s and every multiple is filled in a soft colour, with a legend under the chart. A number that belongs to two chosen patterns is split diagonally in both colours, so 30 shows the 3s colour and the 10s colour. Odd or even shading in grey sits underneath and combines with the highlights.
Yes, on both US Letter and A4. A single chart prints at about 6.7 inches wide (7 in large print) with the title and name line above it; a 120 chart is slightly narrower to make room for its twelve rows. Two charts per page print at about 3.9 inches wide each, which still gives numbers large enough for a child to write in.
More free printable makers
More sheets you can make right now
Each of these builds the printable in your browser: no account, no AI, no weekly limit, an answer key where one applies.
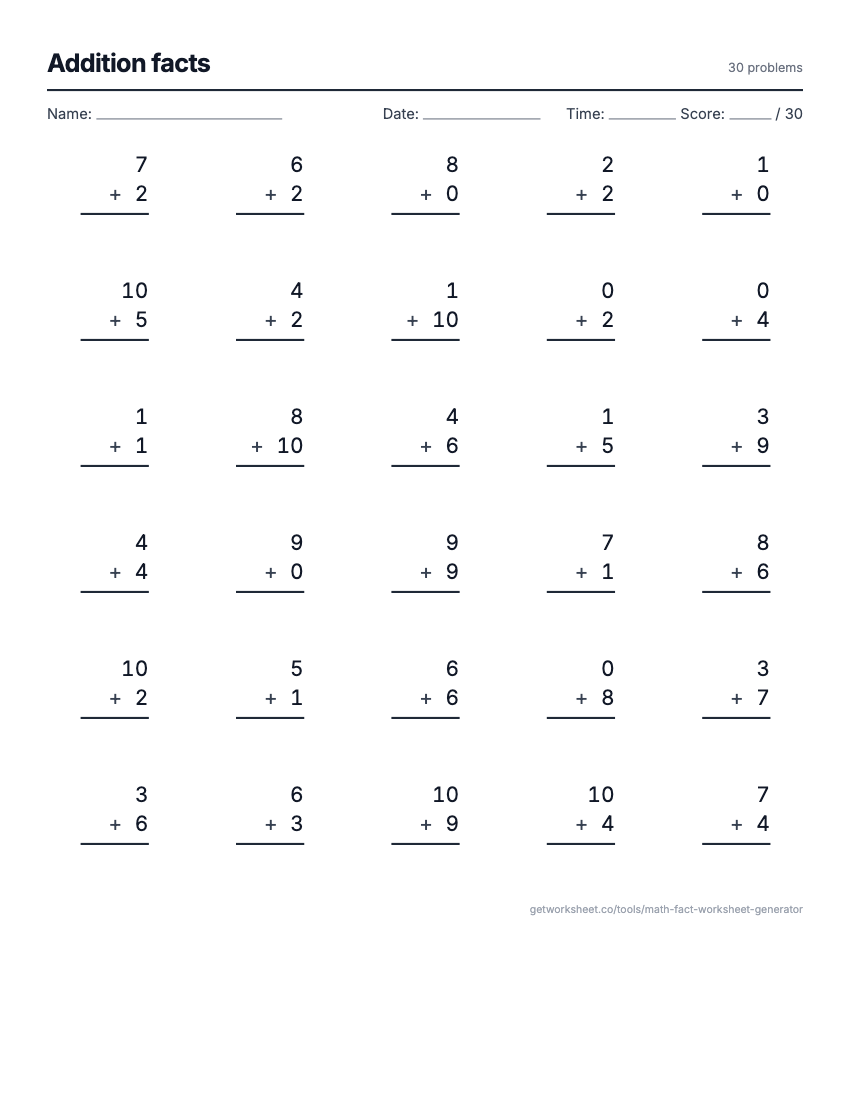 Math fact worksheet generatorAddition to division drills with an answer key. Free to print.
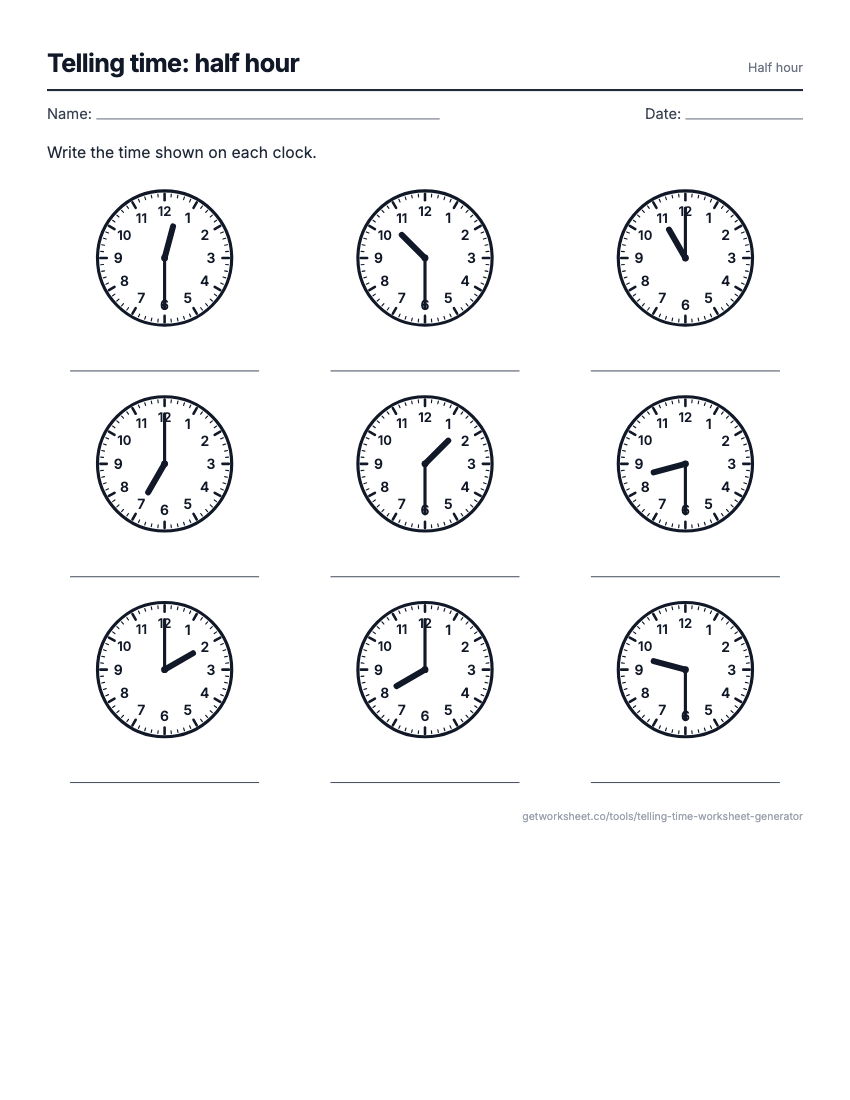 Telling time worksheet generatorAnalogue clocks to read, draw, match or add time to, with answer key. Free to print.
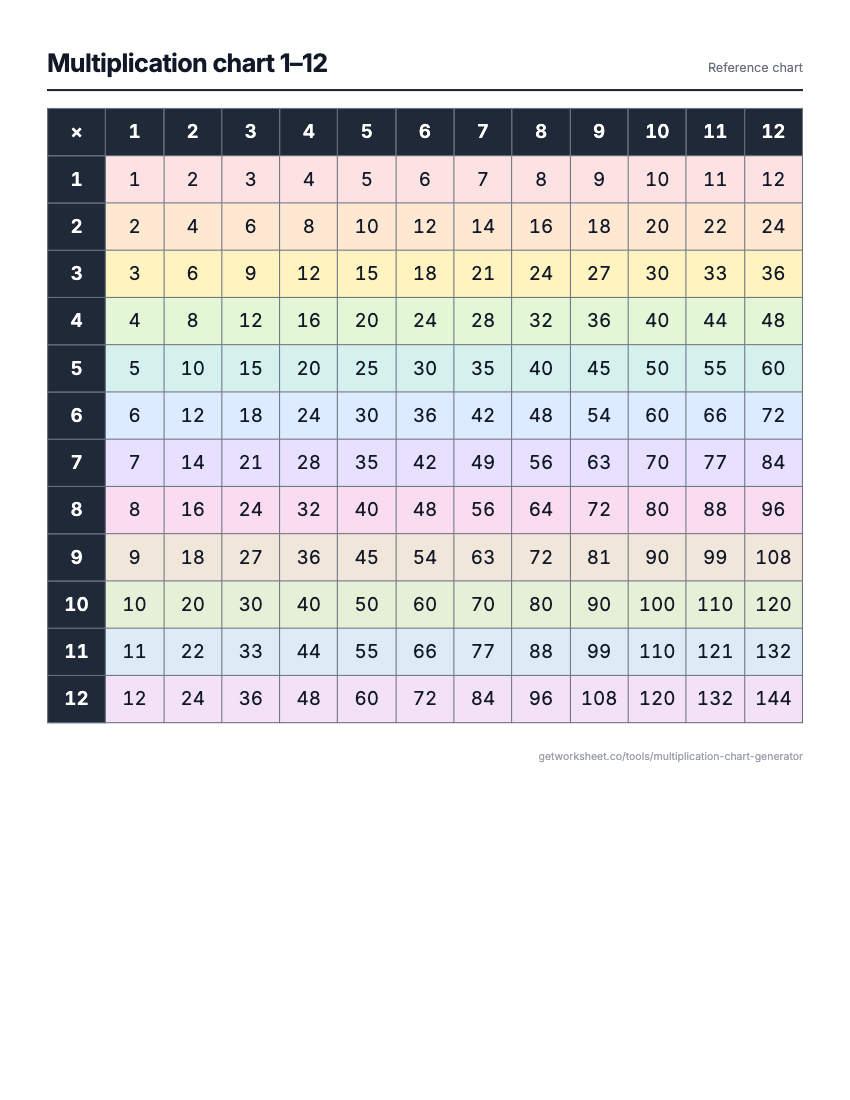 Multiplication chart generatorCharts to 15, full, blank or coloured, and times table tests with key. Free to print.
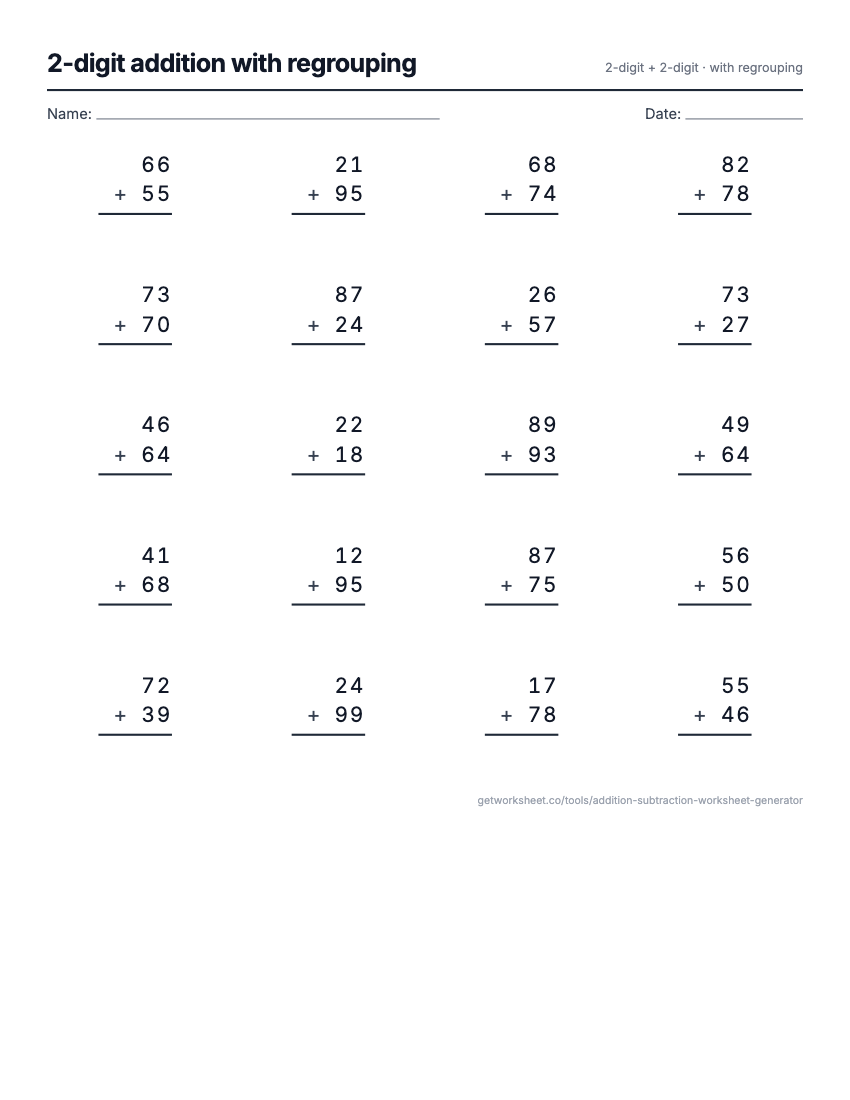 Addition and subtraction generatorColumn add and subtract, regrouping you control, boxes and key. Free to print.
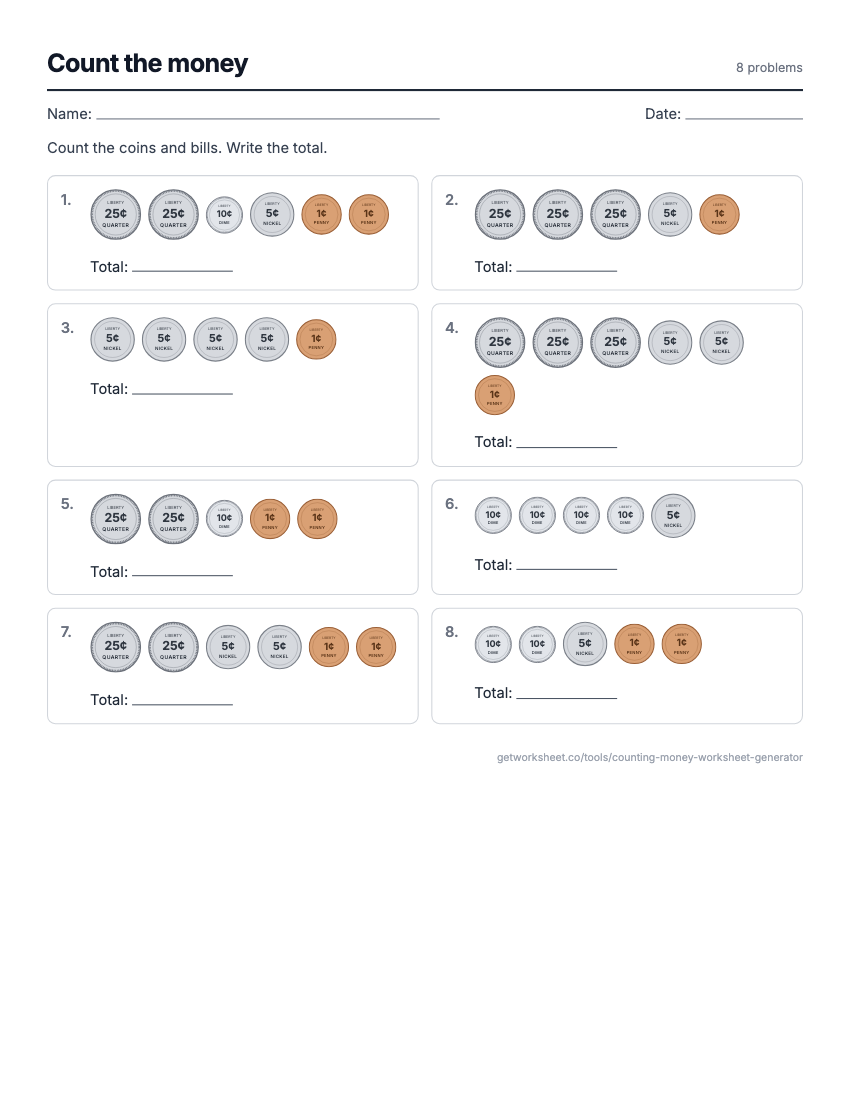 Counting money worksheet generatorCount US coins, make change, compare groups, write amounts. Answer key. Free to print.
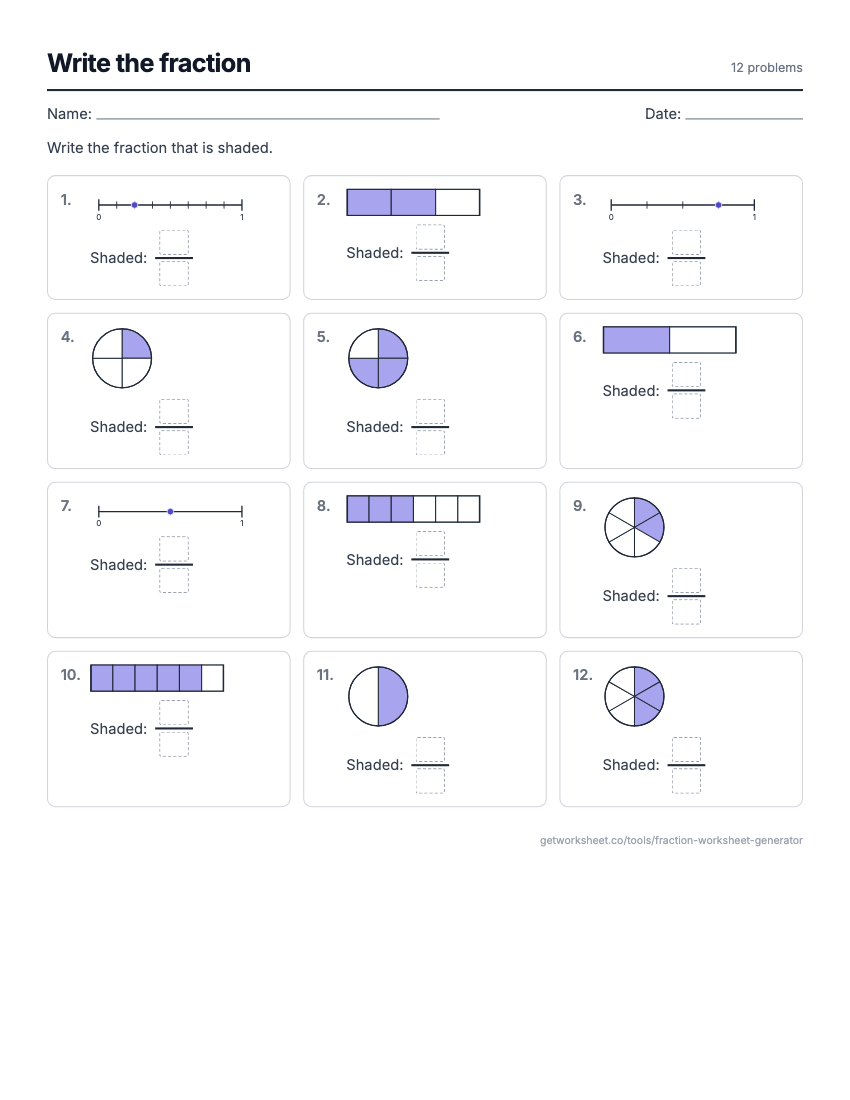 Fraction worksheet generatorVisual pie, bar and number-line models; equivalent, compare, add, subtract. Free to print.
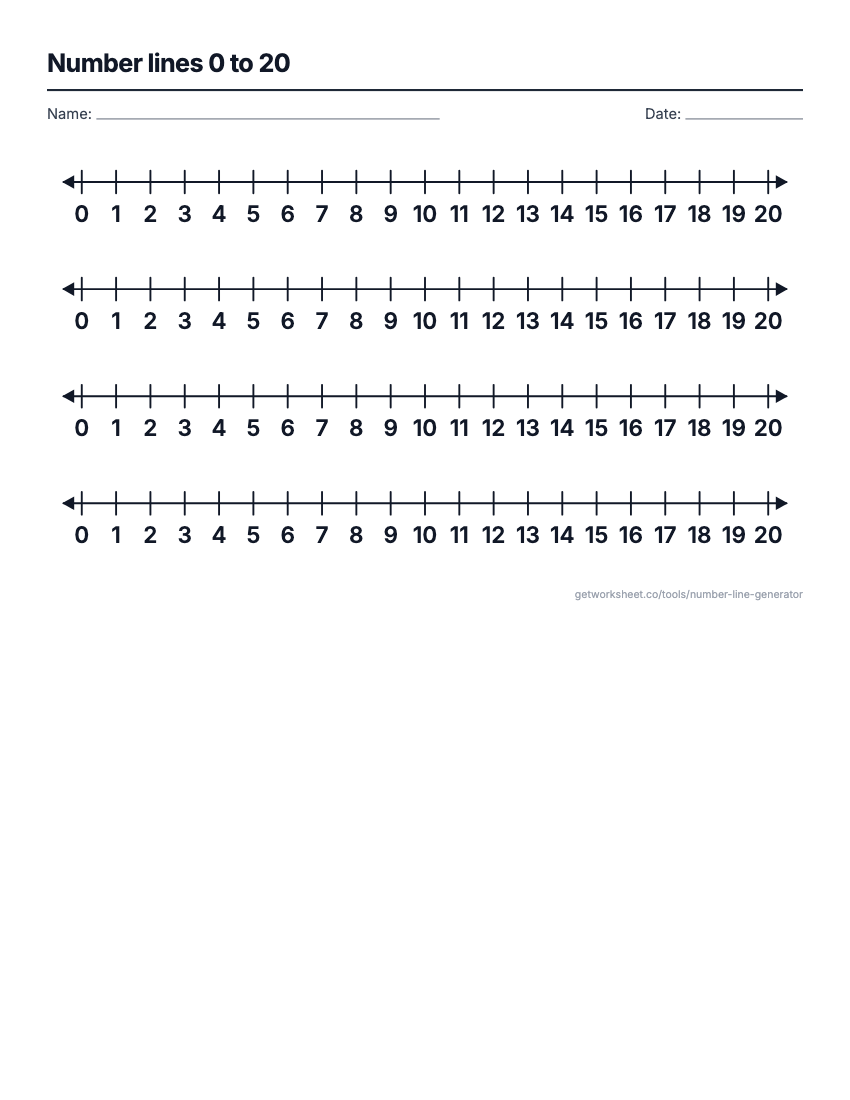 Number line generatorAny range and step, fractions and decimals, blank or missing numbers with a key. Free to print.
- Worksheet generatorCustom worksheets for any topic, grade and question type.
- Lesson plan generatorStandards-aligned plans with objectives, activities and assessment.