Special education tool
Progress Monitoring Data Sheet Generator
Paste an IEP goal. Get the data collection sheet and the graph that goes with it: the goal's scale and target, the aim line from your baseline, the decision rule, and a row for every session.
The goal to monitor
Paste the whole goal sentence; the scale and target are read from it.
Current score
Paste a goal, get the data sheet and graph
A collection sheet for 18 data points, a graph scaled to the goal with the aim line drawn, and the decision rule. Ready to print.
For special education teachers
The whole IEP cycle, one click apart
Each step hands its result to the next: the goal becomes the probes, the probes feed the data sheet, the data writes the progress report. Nothing to retype.
1Goal
Write the IEP goal
Grade, domain and the need in a sentence. You get SMART goals with condition, behavior, criteria, consistency and timeline.
Open2Probes
Make the probe worksheets
Parallel forms of the exact skill, the goal's item count and accuracy target, one form per page.
Open3Data
Collect the data
A data sheet and a graph scaled to the goal, with the aim line and the decision rule already on it.
You are here
4Plan
Plan for behavior
Operational definition, function hypothesis, replacement behavior, strategies, and a blank ABC sheet.
Open5Report
Report progress
Present levels and the quarterly progress comment written from the numbers on the data sheet, plus a parent version.
Open6Supports
Accommodations checklist
IEP-ready accommodations by category with a one-page handout for the general education teacher.
Open7Printables
Visual schedule and token board maker
Picture schedules, First/Then boards and token boards. Pick pictures, type the steps, print. Free.
Open
How it works
How to set up progress monitoring for an IEP goal
Three steps from the goal to a sheet your para can run.
- 1
Paste the goal
Copy the goal from the IEP or from the IEP goal generator. Add the baseline score if you have one.
- 2
Set the schedule
How many data points a week and for how many weeks. The sheet and graph size themselves to it.
- 3
Print and plot
Print both pages. Record each probe score in the table and plot it on the graph against the aim line.
Good questions.
Something else? hello@getworksheet.co
Page one is the data collection sheet: the goal, what one data point measures, baseline and target, how to collect, and a row for every session (week, date, probe form, score, met target, notes). Page two is the graph scaled to the goal with the target line and the aim line from your baseline, plus the decision rule and a few intervention ideas if progress stalls.
They are read from the goal sentence: "10 CVC words with 90% accuracy" becomes a score out of 10 with a target of 9. You can type the baseline, how many sessions a week you collect and how many weeks the sheet should cover.
Yes. The same goal opens the IEP worksheet generator for parallel probe forms, and the data sheet links on to the progress report writer, which turns the scores into present levels and a quarterly comment.
Sign in with a free account and you get one AI generation a week shared across every GetWorksheet tool. Printing and saving as PDF are part of Pro ($29 a year), which also removes the weekly limit.
AI teacher tools
More tools for the rest of the week
Every tool shares the same weekly allowance. Read results on screen for free; copy, print and download with Pro.
- IEP goal generatorMeasurable goals in minutes, then probe worksheets for each one.
- IEP worksheet generatorPaste a goal, get practice probes and a progress record sheet.
- Behavior intervention planFunction, replacement behavior, strategies, ABC and tally sheets.
- IEP progress reportPresent levels and progress comments written from your data.
- Accommodations checklistIEP-ready accommodations by category with a teacher handout.
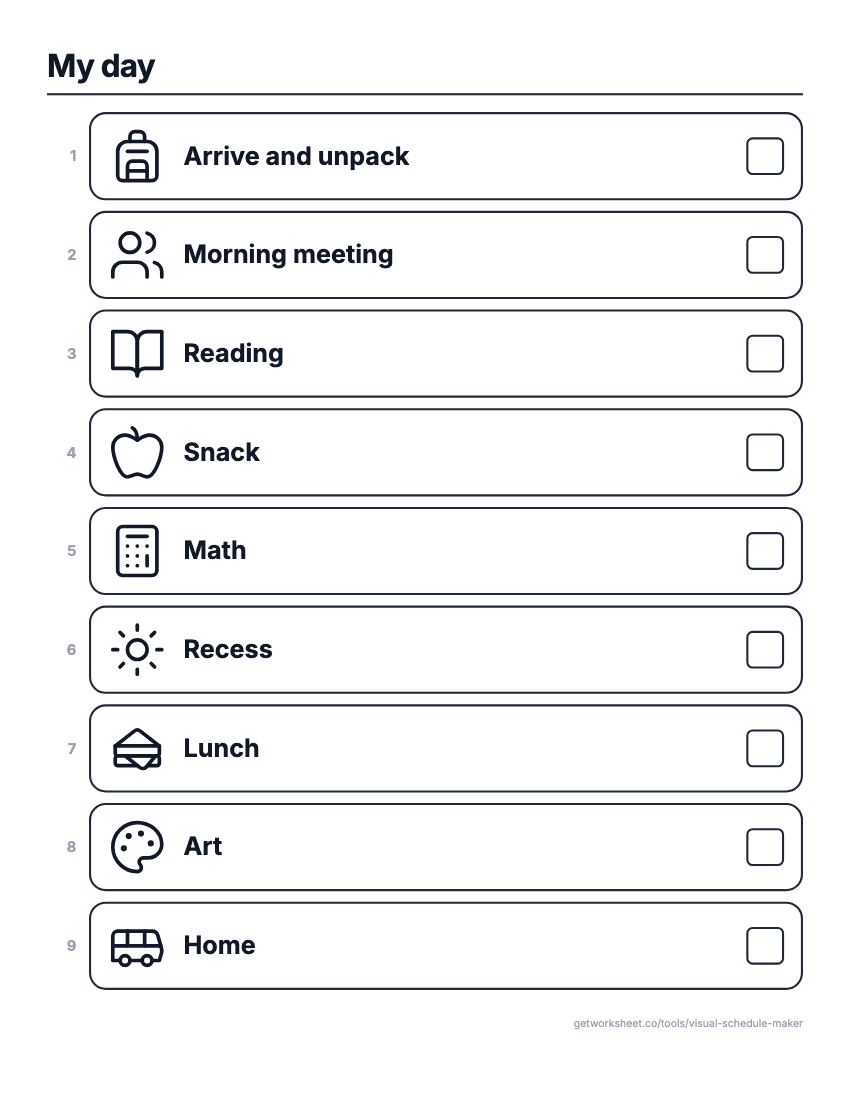 Visual schedule makerPicture schedules, First/Then and token boards. Free to print.
- Worksheet generatorCustom worksheets for any topic, grade and question type.
- Lesson plan generatorStandards-aligned plans with objectives, activities and assessment.
- Report card commentsPersonalised, professional comments for every student.